One of the unsung or rather unknown important aspects in any reported BAC result is the calibration curve. It is not a curve but must be a line. It is known as analytical linearity.
it is part of the three limits:
- Limit of Detection (I blogged on this at Underage Drinking and DUI in Pennsylvania: LOD and LOQ Defense)
- Limit of Quantification (I blogged on this at Underage Drinking and DUI in Pennsylvania: LOD and LOQ Defense)
- Limit of Linearity (I blogged on this at Highest reported BAC .708: I call Shenanigans)
The three limits and their placement on the x,y axis is crucial in all forms of reported Blood Alcohol Content (BAC) results whether it is breath alcohol testing for Blood Alcohol Content (BrAC) or in Blood analysis based Blood Alcohol Content testing.
Before we can consider a reported and alleged result as being remotely precise, accurate, repeatable, reliable, verified, traceable and true, the calibration curve and its linearity is something that must be demonstrated. Without demonstrating linearity on the calibration curve, we can know nothing.
The calibration curve is established by comparing different concentrations of the analyte of interest using known reference standards along increasing levels of concentration. Then the data is graphed on a simple x, y axis for comparison.
The key measure in a calibration curve is called the Correlation Coefficient.
What constitutes a good calibration curve?
First let’s start at the end. What we are looking for is what is called the magic "three nines" or that the Correlation Coefficient along the curve is .999 or better. The correlation coefficient only indicates variance from the averages. It is not the best indicator of curve quality but in the less than certain world (unfortunately) of Government BAC determination, it is the standard. The Pearson correlation coefficient indicates the strength of a linear relationship between two variables, but its value generally does not completely characterize their relationship.
.jpg)
(Pictured above is a set of four scatter-plots with the exact same correlation of 0.816, but the data is radically different)
When is there a problem? What should we look for?
- Generally, data points should be evenly distributed around the curve. If most of the points fall to one side of the line or are not evenly divided by the line, there may be a problem with the curve.
- Is there at least three or more values along the curve from NIST traceable or USP grade raw materials? Anything less than three is not forensically acceptable. The forensically acceptable method of using reference solution or calibrators consisting of NIST or USP grade raw materials verified by an independent lab from the manufacturer using a GC-FID is a minimum.
- The referencce solutions or calibrators must be at low levels at or around the LOQ and LOD, a mid-point and at a very high point (one beyond the highest expected result). Scientifically, to have meaning, the reference solutions should be evenly distributed along the curve. Standards should not exceed five (5) fold changes in concentration at most.
- "Forced zeroing" where the analyst forces the intercept to reach zero in the x,y intercept instead of where the data demands.
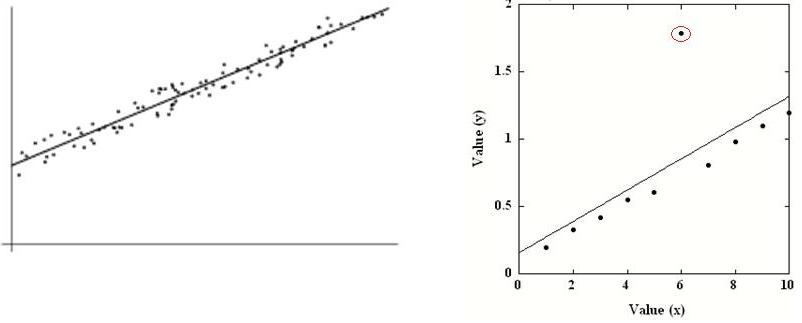
(pictured on the left: a "good" calibration curve with many points of data, evenly spread, not purposefully re-zeroed artificially to the zero point on the x,y axis, characterized by data points on both side of line and with a correlation coefficient of three nines)
(pictured on the right: a "poor" or "bad" calibration curve with all data points on one side of the line, and one extreme, extreme outlier on the other side of the line
So what if we see high Correlation Coefficients or non-linear results on the calibration curve?
Calibration curves which are not linear may imply problems in the analytical process such as saturation or degradation. On other words, the result is not trustworthy. Random divergence in a curve can result from numerous factors including extraction/digestion, poor technique, or dirty or
malfunctioning instrumentation among others. Again, the result is not trustworthy.
The comparison between the known as established by the calibration curve and the unknown of the sample is what we are doing to come to the magic BAC number.
As we are constantly measuring the unknown amount of ETOH or drugs in the blood, a poor or inaccurate calibration curve means for disaster for the citizen accused and for truth.
![]()
-Justin J. McShane, Esquire, Pennsylvania DUI Attorney
I am the highest rated DUI Attorney in PA as Rated by Avvo.com
You can follow me on Twitter, Facebook or Linkedin

Board Certified Criminal Trial Advocate
By the National Board of Trial Advocacy
A Pennsylvania Supreme Court Approved Agency

Justin McShane
PA DUI attorney Justin J. McShane is the President/CEO of The McShane Firm, LLC - Pennsylvania's top criminal law and DUI law firm. He is the highest rated DUI attorney in PA as rated by Avvo.com. Justin McShane is a double Board certified attorney. He is the first and so far the only Pennsylvania attorney to achieve American Bar Association recognized board certification in DUI defense from the National College for DUI Defense, Inc. He is also a Board Certified Criminal Trial Advocate by the National Board of Trial Advocacy, a Pennsylvania Supreme Court Approved Agency.
Minnesota DWI Lawyer says:
Impressive blog post, Justin. The scientists from Minnesota’s crime lab need to read this. They don’t seem to understand.
_________________
-Charles A. Ramsay, Esquire, Minnesota DWI Lawyer
Jcksh says:
If the standard curve is low, does the data go up or down in relation to the graph and why?
Justin McShane says:
I think you are trying to ask if the calibration curve is biased low, correct?